3 Graphs Showing Why Today’s Housing Market Isn’t Like 2008
With all the headlines and talk in the media about the shift in the housing market, you might be thinking this is a housing bubble. It’s only natural for those thoughts to creep in that make you think it could be a repeat of what took place in 2008. But the good news is, there’s concrete data to show why this is nothing like the last time. There’s Still a Shortage of Homes on the Market Today, Not a Surplus For historical context, there were too many homes for sale during the housing crisis (many of which were short sales and foreclosures), and that caused prices to fall dramatically. Supply has increased since the start of this year, but there’s still a shortage of inventory available overall, primarily due to almost 15 years of underbuilding homes. The graph below uses data from the National Association of Realtors (NAR) to show how the months’ supply of homes available now compares to the crash. Today, unsold inventory sits at just a 3.2-months’ supply at the current sales pace, which is significantly lower than the last time. There just isn’t enough inventory on the market for home prices to come crashing down like they did last time, even though some overheated markets may experience slight declines. Mortgage Standards Were Much More Relaxed Back Then During the lead-up to the housing crisis, it was much easier to get a home loan than it is today. Running up to 2006, banks were creating artificial demand by lowering lending standards and making it easy for just about anyone to qualify for a home loan or refinance their current home. Back then, lending institutions took on much greater risk in both the person and the mortgage products offered. That led to mass defaults, foreclosures, and falling prices. Today, things are different, and purchasers face much higher standards from mortgage companies. The graph below uses Mortgage Credit Availability Index (MCAI) data from the Mortgage Bankers Association (MBA) to help tell this story. In that index, the higher the number, the easier it is to get a mortgage. The lower the number, the harder it is. In the latest report, the index fell by 5.4%, indicating standards are tightening. This graph also shows just how different things are today compared to the spike in credit availability leading up to the crash. Tighter lending standards over the past 14 years have helped prevent a scenario that would lead to a wave of foreclosures like the last time. The Foreclosure Volume Is Nothing Like It Was During the Crash Another difference is the number of homeowners that were facing foreclosure after the housing bubble burst. Foreclosure activity has been lower since the crash, largely because buyers today are more qualified and less likely to default on their loans. The graph below uses data from ATTOM Data Solutions to help paint the picture of how different things are this time: Not to mention, homeowners today have options they just didn’t have in the housing crisis when so many people owed more on their mortgages than their homes were worth. Today, many homeowners are equity rich. That equity comes, in large part, from the way home prices have appreciated over time. According to CoreLogic: “The total average equity per borrower has now reached almost $300,000, the highest in the data series.” Rick Sharga, Executive VP of Market Intelligence at ATTOM Data, explains the impact this has: “Very few of the properties entering the foreclosure process have reverted to the lender at the end of the foreclosure. . . . We believe that this may be an indication that borrowers are leveraging their equity and selling their homes rather than risking the loss of their equity in a foreclosure auction.” This goes to show homeowners are in a completely different position this time. For those facing challenges today, many have the option to use their equity to sell their house and avoid the foreclosure process. Bottom Line If you’re concerned we’re making the same mistakes that led to the housing crash, the graphs above should help alleviate your fears. Concrete data and expert insights clearly show why this is nothing like the last time. Graham Team Real Estate • (702) 930-9551 • Team@grahamteamnv.com Instagram | Facebook | YouTube | LinkedIn | TikTok 980 American Pacific Dr. Ste. 111 Henderson, NV 89014

Mortgage Rates Are Dropping. What Does That Mean for You?
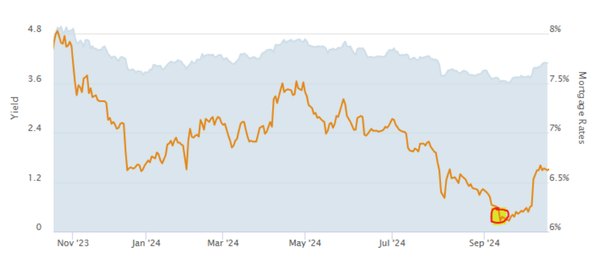
Mortgage rates have been a hot topic in the housing market over the past 12 months. Compared to the beginning of 2022, rates have risen dramatically. Now they’re dropping, and that has to do with everything happening in the economy. Nadia Evangelou, Senior Economist and Director of Forecasting at the National Association of Realtors (NAR), explains it well by saying: “Mortgage rates dropped even further this week as two main factors affecting today’s mortgage market became more favorable. Inflation continued to ease while the Federal Reserve switched to a smaller interest rate hike. As a result, according to Freddie Mac, the 30-year fixed mortgage rate fell to 6.31% from 6.33% the previous week.” So, what does that mean for your homeownership plans? As mortgage rates fluctuate, they impact your purchasing power by influencing the cost of buying a home. Even a small dip can help boost your purchasing power. Here’s how it works. The median-priced home according to the National Association of Realtors (NAR) is $379,100. So, let’s assume you want to buy a $400,000 home. If you’re trying to shop at that price point and keep your monthly payment about $2,500-2,600 or below, here’s how your purchasing power can change as mortgage rates move up or down (see chart below). The red shows payments above that threshold and the green indicates a payment within your target range. This goes to show, even a small quarter-point change in mortgage rates can impact your monthly mortgage payment. That’s why it’s important to work with a trusted real estate professional who follows what the experts are projecting for mortgage rates for the days, months, and year ahead. Bottom Line Mortgage rates are likely to fluctuate depending on what happens with inflation moving forward, but they have dropped slightly in recent weeks. If a 7% rate was too high for you, it may be time to contact a lender to see if the current rate is more in line with your goal for a monthly housing expense.

Homeownership Is an Investment in Your Future
There are many people thinking about buying a home, but with everything affecting the economy, some are wondering if it’s a smart decision to buy now or if it makes more sense to wait it out. As Bob Broeksmit, President and CEO of the Mortgage Bankers Association (MBA), explains: “The desire for homeownership is strong. Many prospective buyers are waiting for the volatility in mortgage rates to subside, as well as for a clearer picture of the economic outlook.” If you’re in that position, remember that it’s important to consider not just what’s happening today but also what benefits you may gain in the long run. There’s a lot of information out there about how homeownership helps build a homeowner’s net worth over time. But even today, many people think first about things like 401(k)s before they think of owning a home as a wealth-building tool. It’s especially important if you’re a young prospective homebuyer to understand how homeownership is another key way to invest in your future. An article from Bloomberg notes: “Millennials have higher average 401(k) balances than Generation X did when they were the same age, but they’re not any better off financially. . . . A lot of that has to do with being less likely to own a home.” To help you understand just how much owning a home can have a positive impact on your life over the years, take a look at what the data shows. The same Bloomberg article helps show the gap in wealth between renters and homeowners who are 65 years and older (see graph below). The difference is substantial, even when incomes are similar. So, if you want to create wealth to help set you up for success later on, it may be time to prioritize homeownership. That’s because, whether you decide to rent or buy a home, you’ll have a monthly housing expense either way. The question is: are you going to invest in yourself and your future, or will you help someone else (your landlord) increase their wealth? Bottom Line Before putting your homeownership plans on hold, let’s connect to go over your options. That way, you’ll have expert advice on how to make the best decision right now and the best investment in your future. Graham Team Real Estate • (702) 930-9551 • Team@grahamteamnv.com Instagram | Facebook | YouTube | LinkedIn | TikTok 980 American Pacific Dr. Ste. 111 Henderson, NV 89014
Categories
Recent Posts

